


Related Content
Read More: RK&K has an exemplary record in the planning, design, installation, and troubleshooting of Corrosion Protection systems.
This article originally appeared in Chesapeake Magazine’s Fall 2020 issue.
Condition assessment is an important component of any asset management framework, so choosing the right condition assessment tool is critical.
The Brock Bridge Road Water Transmission Main (BBWTM), a 20-inch ductile iron water main, constructed in the early 1990s, is the sole source of water supply to Anne Arundel County’s (Maryland) Russett Greens Community and other large services, and is considered a high criticality asset. Having already experienced two failures on this main, the County decided to evaluate the condition of this critical supply main with the primary objective to determine the remaining useful life of the pipeline and to identify any short- or long-term strategies that can be implemented to improve the reliability of this critical asset.
In 2017, the County retained the services of Rummel, Klepper and Kahl, LLP (RK&K) to conduct corrosion study for this pipeline.
[JPG, 77.24 KB]
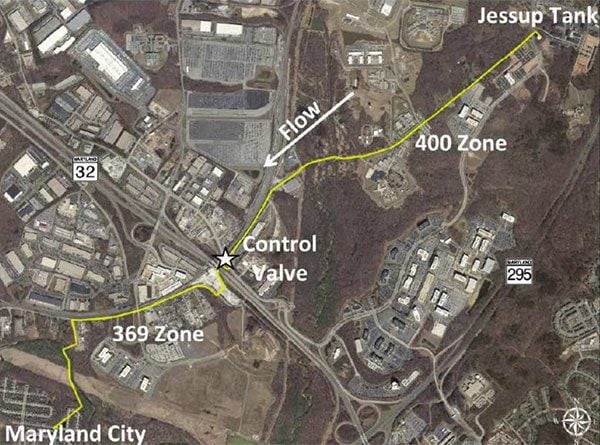
Figure 1: Project LocationThe study area consisted of approximately 17,200 LF or 3.25 miles of pipeline between the Jessup Elevated Water Storage Tank and the Patuxent landing Loop at Lost Creek Boulevard in Maryland City. The study area also included a Control Valve (CV) located approximately halfway which separated upper (400) and lower (369) pressure zones.
The phased approach for condition assessment included both field testing and desktop analysis. Each condition assessment phase employed a different inspection technology, providing increasing levels of resolution and detail on the condition of the pipe. This was considered a “Toolbox Approach” where the most appropriate tools to fit the application were offered and the best use of the County resources to focus inspection services where they are most appropriate. The study consisted of Corrosion Evaluations, Pressure Transient Monitoring, Leak Detection and Average Pipe Wall Thickness Assessment, and Pipeline Risk/ Remaining Life Analysis.
Phase I – Corrosion Evaluation
The rate of corrosion of ferrous pipe can be directly related to the corrosivity of the soil. Soil pH, presence of sulfides, and/or elevated levels of sulfates or chloride ions are other factors that influence the soil corrosivity and in turn contribute to the corrosion of ductile iron pipe. During Phase I, field testing was conducted to determine the corrosivity of the soils along the pipeline alignment. The field testing included soil resistivity measurements utilizing Wenner FourPin method at 34 locations along the pipeline and a Barnes Layer analysis, in-situ soil pH measurements, and stray current testing to determine the presence of stray current. Nine soil samples were collected and lab tested for pH, chloride levels, redox potential and presence of sulfides. The soil resistivity at pipeline depth ranged from 1,452 ohm-cm to 64,635 ohm-cm.
The 10-point soil evaluation procedure of the ANSI/A\NWA C105/A21.5 Standard was utilized to determine the degree of soil corrosivity. Three of the 34 test locations scored ten points or higher, which indicated that the soil is corrosive to ductile iron pipe at those locations. The result of the Phase I investigation was used to support the Phase Ill and IV of the overall corrosion study.
Phase II – Pressure Transient Monitoring
[JPG, 44.94 KB]
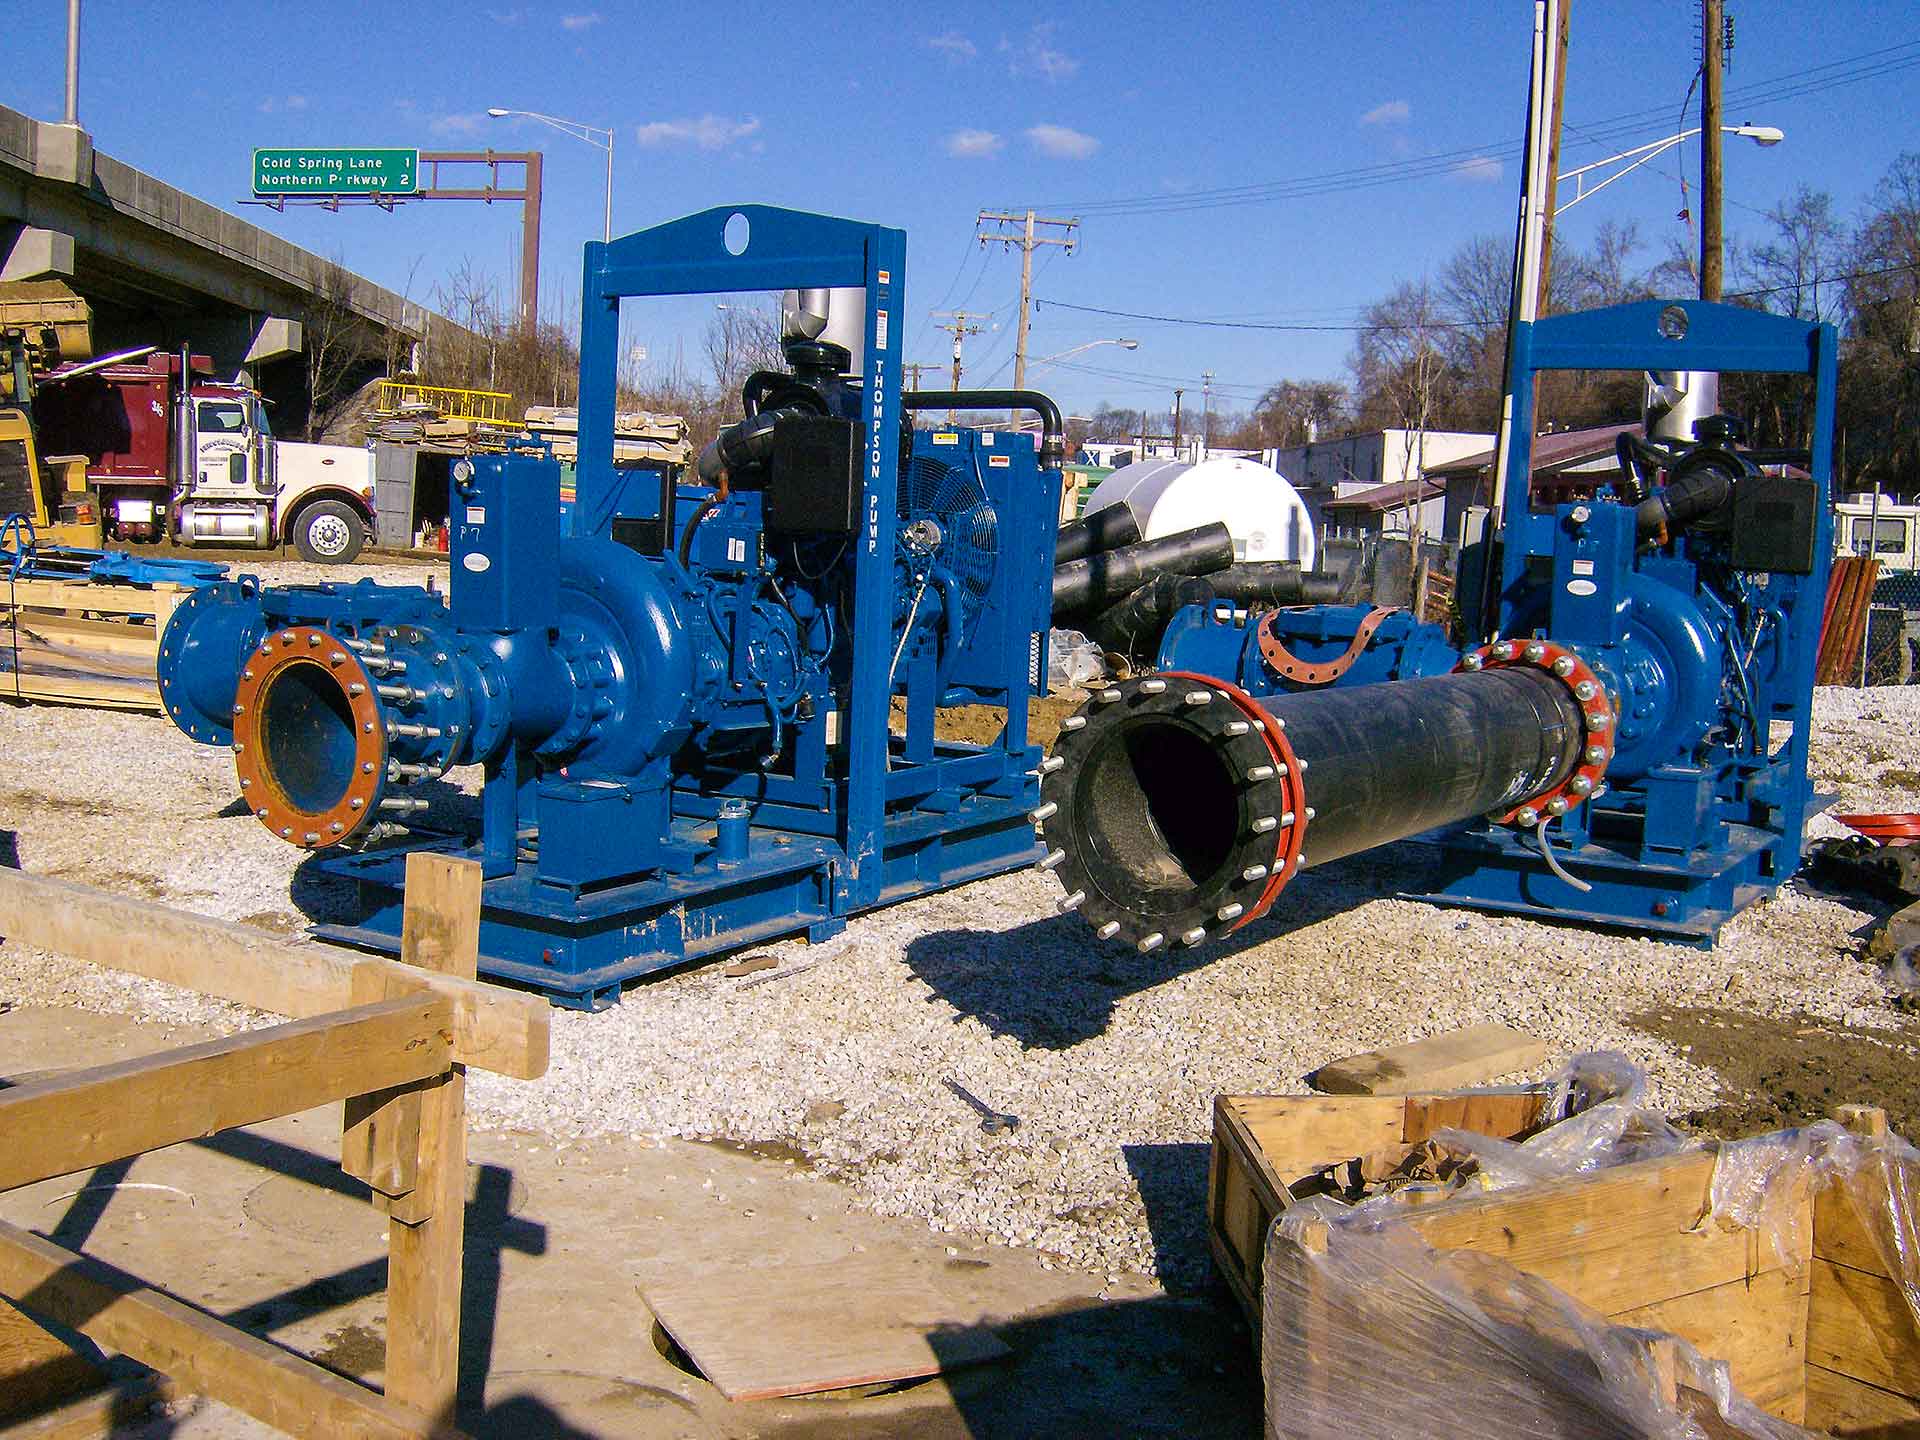
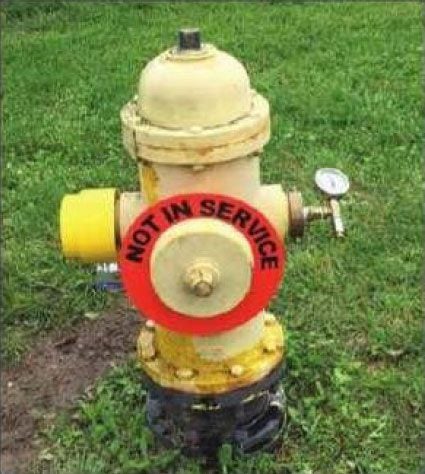
Figure 2: Telog® Pressure Recorder Installed on HydrantTransients in pipelines (closed conduits) associated with the rapid change in flow is also referred to as “water hammer.” The pressures generated by water hammer in pipe systems are frequently three or more times the value of normal operating pressures. These transient events can cause serious problems in water distribution systems. High water hammer pressure can permanently deform or rupture a pipeline and its components while low pressure can collapse a pipeline, causing leaks, disrupting service, and contaminating pipelines.
Phase II study included conducting field testing to measure operating pressures on the pipeline to determine the presence and magnitude of pressure surges or transients that may be subjecting the pipeline to risk of rupture. Two rounds of pressure transient monitoring were conducted; during each round, the Telog® hydrant pressure recorders (Model HPR-31i by Telog Instruments) were installed on two fire hydrants, one each upstream and downstream of the control valve, for seven consecutive days and pressure data was collected.
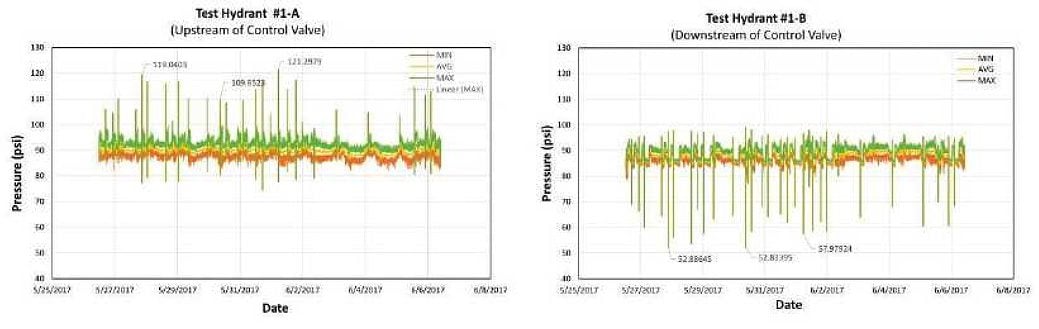
[JPG, 46.20 KB]
Figure 3: Pressure Transient Monitoring Test ResultsThere were no sudden or significant pressure transients recorded during two rounds of monitoring. There were some upsurge and downsurge events observed at the test hydrants closest to the control valve, which were mainly attributed to the operation (opening and closing) of the control valve. Based on this analysis, no immediate actions were required for transient pressure control; however, it was noted that the operating parameters of the control valve should be closely monitored to prevent any malfunction which could trigger high pressure transients in the pipeline.
Phase III – ePulse® Condition Assessment and Leak Detection
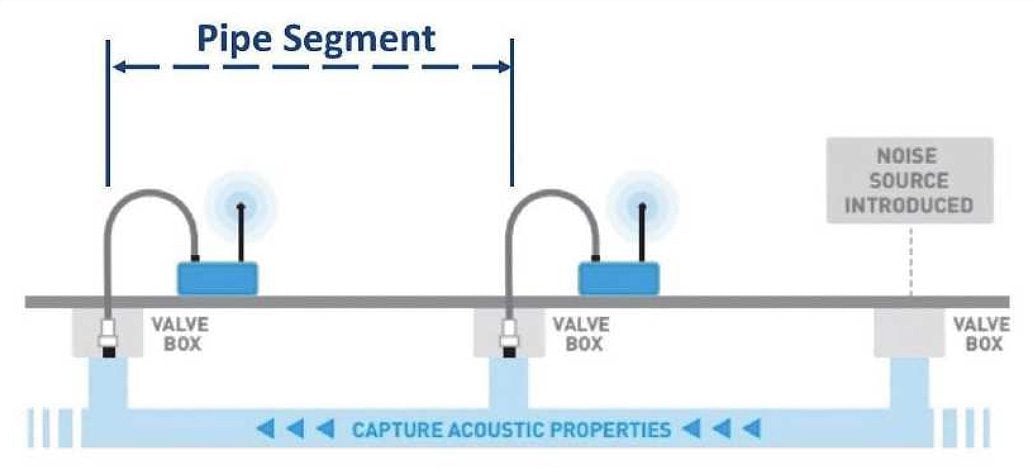
Phase Ill of the study included Leak Detection and Average Pipe Wall Thickness Assessment by Echologics®. Leak detection was conducted along the entire stretch of BBWTM. Echologics used EchoShore®-M leak detection system which consists of mobile leak detection nodes that capture and transmit acoustic leak detection data using sensitive sensors attached to the pipeline. For this study, the acoustic sensors were connected at valve operating nuts, fire hydrants, and directly to the pipe. The leak detection sensors were spaced up to 2,500 feet apart along the pipeline.
A total of 14 pipe segments or about one mile of pipeline was selected for ePulse condition assessment. The condition assessment areas were selected based on the results of Phase I Corrosion Evaluations, water main break history, and the availability of existing access fittings (valves, hydrants, etc.) within the maximum suggested sensor spacing of 600 feet.
The Echologics’ ePulse system consists of two acoustic sensors attached to the existing contact points, such as valves, fire hydrants, and directly to the pipeline. A sound wave is then induced in the pipeline and travels along the pipe. The acoustic sensors capture the time it takes the sound wave to travel between two sensor stations. The speed at which the sound wave travels is dictated by the condition of the pipe wall. The ePulse results data represents the average pipe wall thickness between sensor attachment points.
[JPG, 30.85 KB]
Figure 4: ePulse® Condition Assessment and Leak DetectionNo leaks were discovered during the leak detection survey.
It was concluded based on the results of the Phase Ill investigation alone that installation of permanent leak monitoring equipment was not necessary.
The ePulse condition assessment analysis results indicated no major anomalies in the pipeline; however, some of the pipe segments posed higher risk than others based on the percentage hoop thickness loss recorded for those segments.
- Six pipe segments were found to be in moderate condition with 10% to 30% loss in original wall thickness.
- Seven pipe segments were found in relatively good condition with less than 10% loss in original wall thickness; however, two of these pipe segments had high margin of error due to inaccuracy in the pipe segment length, which could mean these pipe segments might have high hoop thickness loss.
- One segment could not be evaluated because of poor sound propagation and significant radio interference.
It is also important to note that the ePulse condition assessment measures the average minimum hoop thickness of the entire pipe segment, which does not necessarily reflect the true condition of the pipe at any given point within that pipe segment.
The results of the Phase Ill investigation were utilized in conducting the overall pipeline risk/remaining life analysis during Phase IV.
Phase IV – Pipeline Risk/Remaining Life Analysis
The final phase of the project was completed in two parts. The first part involves pipe segment prioritization using the risk-based prioritization model. Once the pipe segments were prioritized and potential high-risk pipe segments identified, visual inspection and pipe wall thickness measurements were conducted on high-risk pipe segments to determine the remaining useful life.
Part A – Pipe Segment Prioritization
A four-step process was used for pipe segment prioritization. This first part was mostly completed using desktop analysis by utilizing the results from Phase I, II, and Ill evaluations as well as historic data about the pipeline and other pertinent information.
- Identify Condition and Criticality Factors
- Assign Levels and Relative Importance
- Calculate Condition and Criticality Rating
- Risk Score and Prioritization
Pipe segment prioritization identified nine pipe segments as potential high-risk pipe segments comprising a total length of 4,543 LF. Following the results of the pipeline risk analysis, it was decided to conduct test pits on all high-risk pipe segments to expose and visually inspect the pipeline and to measure the pipe wall thickness. This was also going to help validating the results of condition assessments conducted under prior phases of this project.
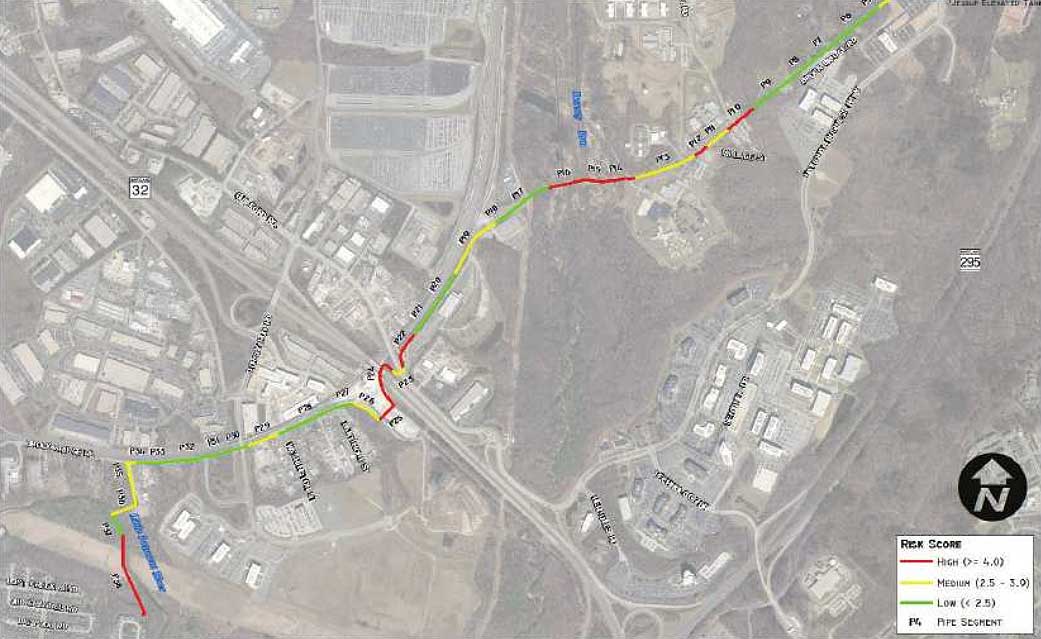
[JPG, 75.33 KB]
Figure 5: Map Showing Phase IV Pipe Segment Prioritization ResultPart B – Visual Inspection and Thickness Measurement
A total of nine test pits were conducted along the pipeline, one each on the nine high-risk pipe segments, and direct corrosion assessment was performed at the test pits. This included, visual inspection of the pipe exterior to determine the presence of external corrosion, corrosion pit depth measurements, and pipe wall thickness measurements using an ultrasonic thickness gage. The locations of the test pits were selected to generally coincide with pipe segments having been assigned high-priority condition and criticality ratings based on the results of the soil corrosivity analysis in Phase I and the ePulse condition assessment in Phase Ill. The sacrificial anode cathodic protection system was installed on the pipeline at four of the nine test pits based on the findings of the soil corrosivity tests.
Pipe wall thickness measurements did not reveal any interior corrosion at any of the test pit locations, which was expected since the pipe was cement-mortar lined. However, eight of the nine locations tested revealed some level of exterior corrosion, and four locations showing severe to moderate levels of corrosion with 25% to 42% metal loss measured at the corrosion pits. It is important to note that the pipeline only had factory-applied bituminous coating on the outside and no polyethylene encasement or sacrificial anode cathodic protection was used during original installation.
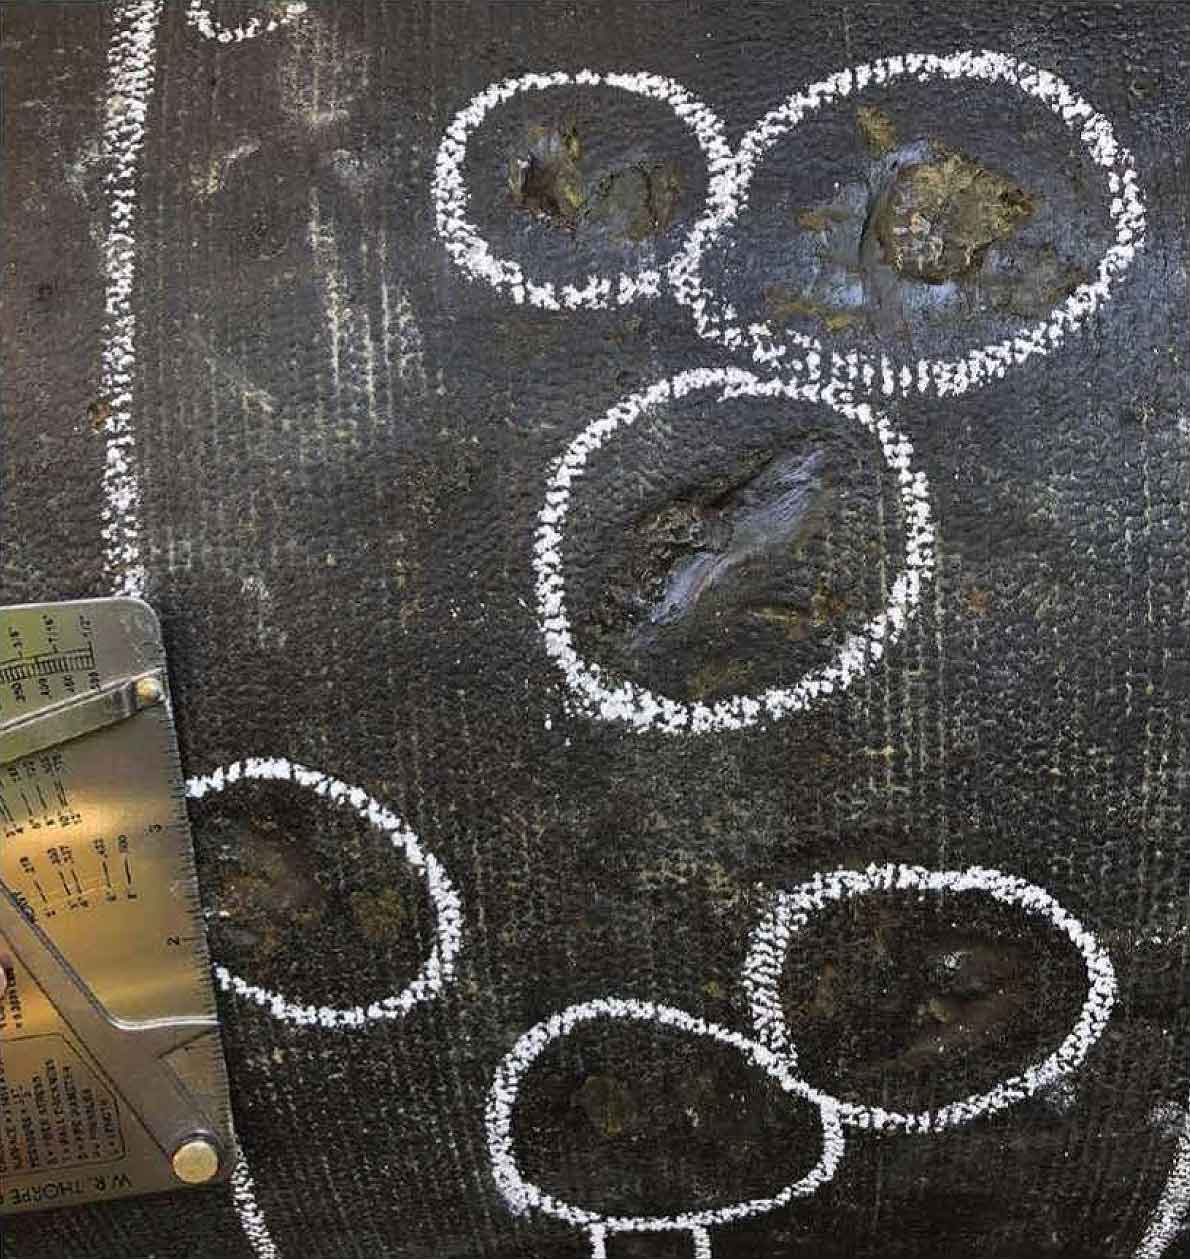
[JPG, 142.20 KB]
Figure 6: Pitting and Graphitization Found on the Exterior of the Pipe During Visual InspectionOverall, the findings of the Phase IV investigations correlated well with the findings of the Phase I testing (Corrosion Evaluations) and the Phase Ill testing (ePulse Condition Assessment). Accordingly, it was concluded that the Phase IV testing successfully validated the data and pipe condition assessments of the prior testing which indicated that active corrosion and pipe wall loss is occurring on pipe segments having highest condition and criticality ratings.
Conclusion
The findings from the phased condition assessment indicated that approximately 25% of the pipeline is showing evidence of moderate to severe metal loss as a result of active pipeline corrosion. Corrosion is expected to continue in the future and an increase in pipe failures are expected to occur on high-risk pipe segments within the next decade or so. To mitigate the risk and to improve reliability of this important supply main, several short-term and long-term corrective actions were put together, including replacement of approximately 5,000 +/- LF of high-risk pipe segments.
Although this approach was used primarily for a single water main, this methodology can be expanded to evaluate the corrosion protection needs of critical pipes on a larger scale, County-wide.
You might also be interested in:
Blog